From groceries to gas, it seems like everything has gotten more expensive in 2025. While most of us are keeping a close eye on rising prices, one recurring cost might be quietly draining your wallet: your phone bill.
In some U.S. cities, residents are paying over $2,500 a year just to stay connected.
But where are people paying the most?
NumberBarn, a phone number management company and marketplace, analyzed average monthly cell phone costs across 50 of the largest U.S. cities to better understand just how much Americans are spending on wireless service each month. We then calculated the average yearly phone bill in each city and also surveyed 1,000 Americans to learn how they’re trying to save money on their mobile plans.
Key Findings
- Chicago has the highest wireless phone bills in America. Residents pay an average of $213.92 per month, or $2,567.04 per year, which is the most expensive in the country.
- Seattle and San Francisco round out the top three, with monthly bills averaging $209.52 and $206.69, respectively.
- Nationwide, the average monthly phone bill is $196.70.
- Federal wireless taxes have increased more than 40% over the last five years, rising from 9.05% in 2019 to 12.8% in 2024.
- Texas dominates the high-cost list, with six cities in the top 10, including Plano, Corpus Christi, Arlington, El Paso, Austin, and Dallas.
- In contrast, San Diego boasts the cheapest phone bills in the nation at $182.66 per month, saving residents more than $375 per year compared to those in Chicago.
- According to our nationwide survey, 57% of Americans are on shared or family phone plans, and 43% of Americans say they’ve taken steps in the past year to reduce their phone bill.
- The Most Expensive Cities for Monthly Phone Bills
- The Cheapest Cities for Monthly Phone Bills
- Why Phone Bills Vary So Much Across the U.S.
- Wireless Phone Service Taxes by State
- Phone Bills: Who’s Paying, and How?
- How to Cut Your Phone Bill (Without Losing Your Number)
- Methodology
The Most Expensive Cities for Monthly Phone Bills
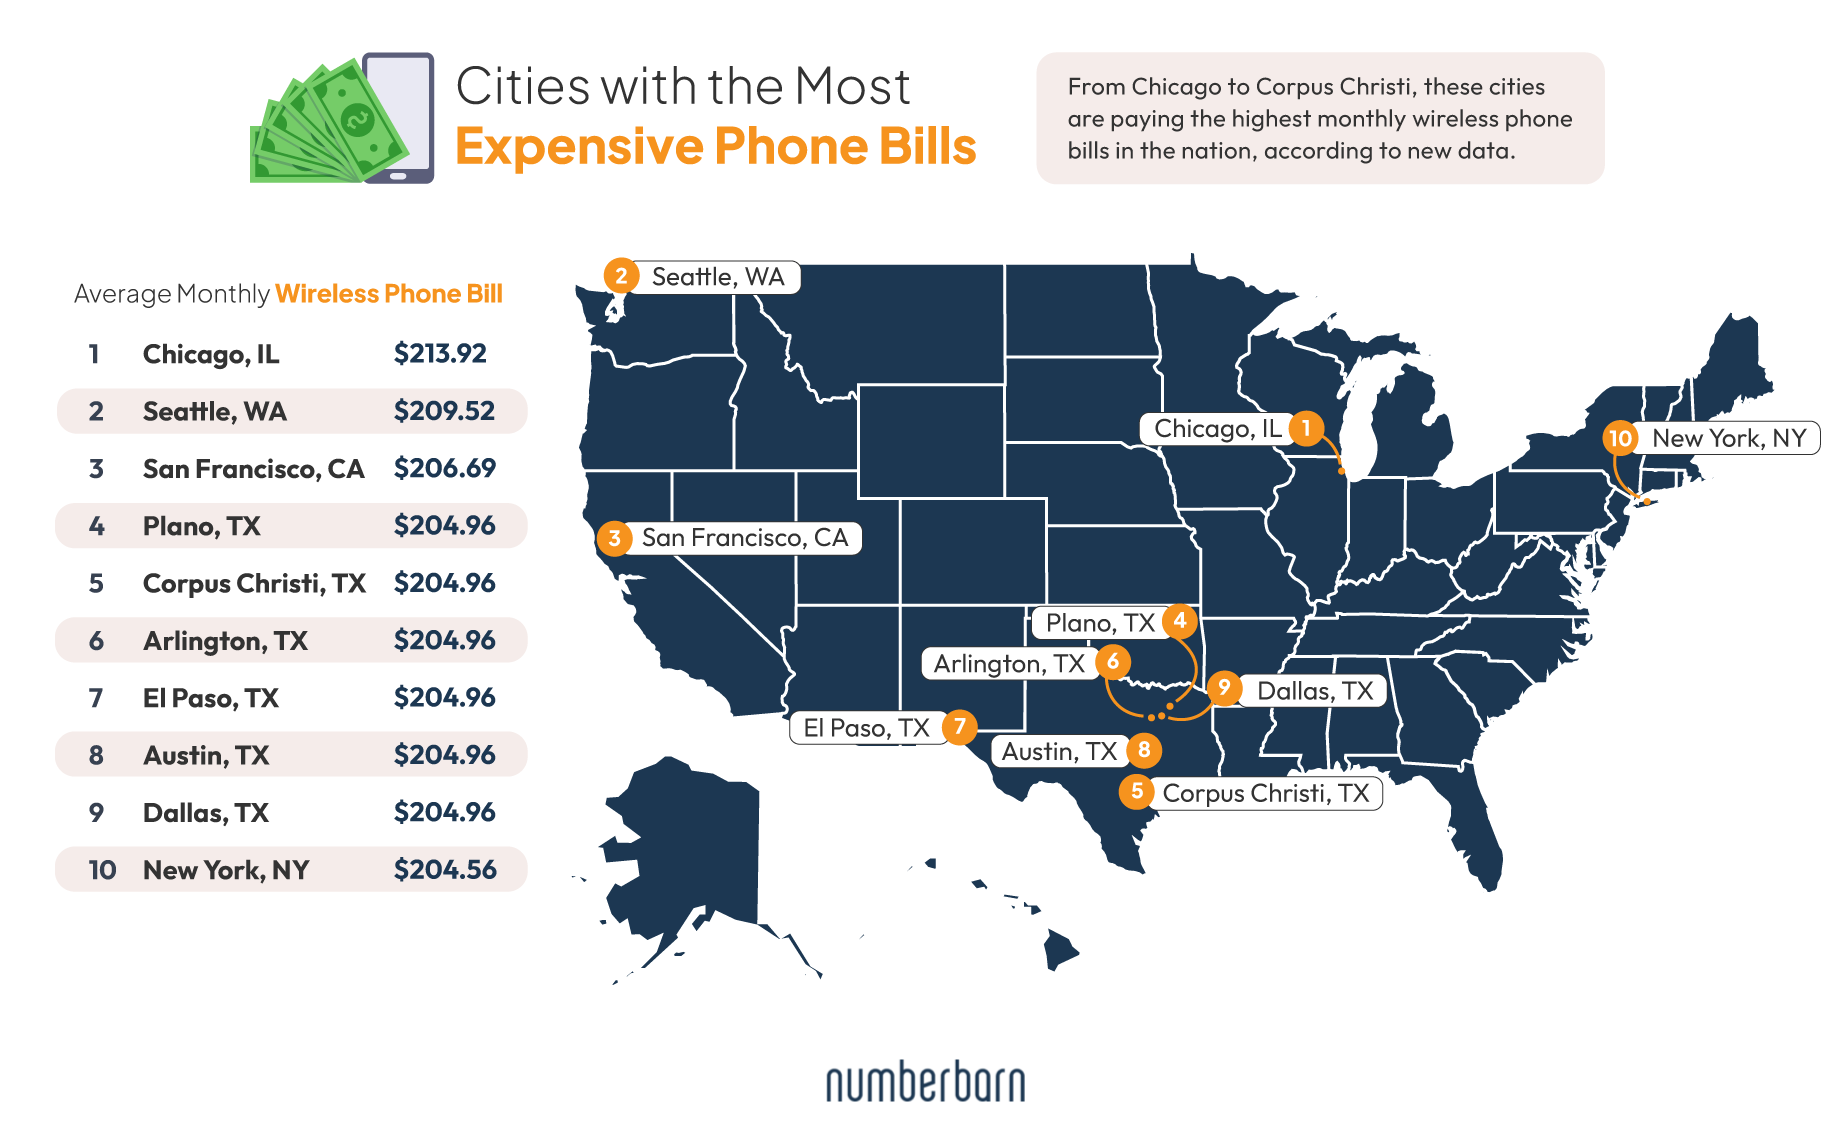
So, which cities are paying the steepest price to stay connected?
According to our analysis, Texas cities dominate the top 10, with six cities in the Lone Star State all reporting average monthly wireless bills just shy of $205. In Texas, several cities including Dallas, Austin, and El Paso all report nearly identical average phone bills, which is likely due to uniform regional pricing strategies by major carriers like Verizon, AT&T, and T-Mobile.
Meanwhile, residents in Chicago, Seattle, and San Francisco are also digging deep into their wallets to cover the cost of staying connected.
Nationwide, the average monthly phone bill is $196.70, according to the Council for Community and Economic Research. These costs might seem high, but 57% of Americans are on shared or family phone plans, according to our survey. That means most households are paying for multiple lines of service.
The Cheapest Cities for Monthly Phone Bills
While some cities are feeling the financial strain of rising wireless costs, others are enjoying relatively affordable bills, especially in the Midwest and South.
In fact, three Ohio cities rank among the top 10 cheapest, with residents paying around $30 to $40 less per month than their counterparts in high-cost metros. That adds up to annual savings of over $300 in some cases.
Explore the cities where phone bills are the easiest on your wallet below.
To better understand how Americans are managing their wireless bills, we surveyed U.S. adults about their phone costs, habits, and energy concerns.
Nearly 4 in 10 Americans (39%) say their wireless phone bill has increased in the past year. And phone bills aren’t the only utility putting pressure on budgets. A majority (74%) say their electric bill has also gone up, which has led to growing concerns about energy consumption in the digital age. In fact, more than 1 in 3 Americans say they’re worried about how much electricity their digital habits (like charging phones, streaming, and using Wi-Fi or cloud services) consume every month.
Why Phone Bills Vary So Much Across the U.S.
Despite having just a few major national carriers, phone bills still differ from city to city. Regional pricing strategies, taxes, infrastructure, and local consumer behavior all play a role.
Carriers like Verizon and AT&T often offer different rates and promotions depending on market competition. While one city might benefit from multi-line deals, another may face higher prices due to fewer options.
Taxes and fees can also drive up costs. For example, Chicago’s wireless service tax exceeds 30%. Add-ons like 911 fees or utility surcharges also vary locally and aren’t always reflected in advertised prices.
In some areas, higher infrastructure costs are passed on to users, especially in rural or hard-to-cover zones.
Wireless Phone Service Taxes by State
While phone plan pricing can vary by city, another often-overlooked factor behind rising phone bills is taxes on wireless services, which are climbing nationwide.
While state-local taxes have inched up, federal wireless taxes have increased more than 40% over the last five years, rising from 9.05% in 2019 to 12.8% in 2024.
This map shows state‑local wireless tax rates for 2024, which is the most recent data available.
In some states, the total wireless tax burden (state, local, and federal) exceeds 30%. Illinois has the highest wireless tax burden in the country, at 36% (state, local, and federal taxes combined), followed closely by Washington (34.4%), and Arkansas (34.2%) in 2024.
Even if you have the same plan and carrier, your total monthly bill could be significantly higher or lower depending on where you live.
Phone Bills: Who’s Paying, and How?
When it comes to who’s footing the bill, most Americans say they’re on a family or shared plan (57%), while 38% are on an individual plan, and 5% have someone else paying their bill entirely.
Still on mom and dad’s phone plan? You’re not alone.
Among single millennials (ages 29-44), 38% report still being on a shared or family phone plan, which is a strong sign that many haven’t fully split from their parents’ family phone bill.
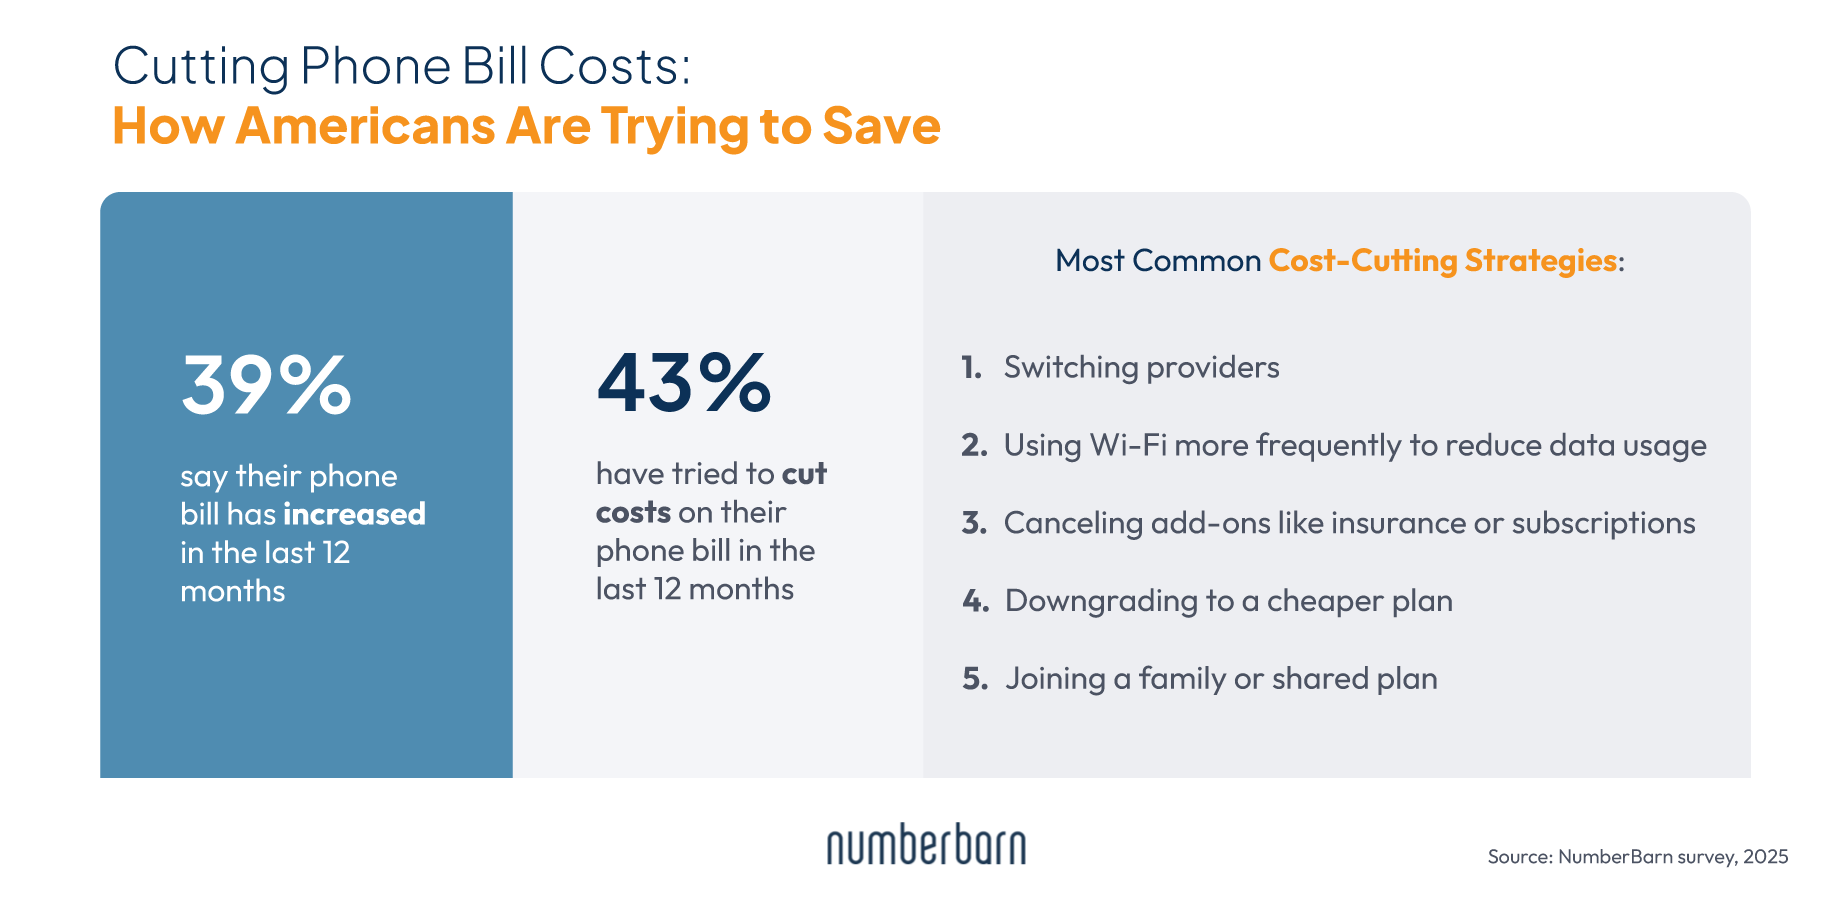
If you can’t hang onto your parent’s phone plan, there are other ways to cut back on your monthly phone bill. Overall, 43% of respondents have taken steps to reduce their phone bill in the past year. The most common strategies include:
- Switching to a new provider: 32%
- Using Wi-Fi more frequently to reduce data usage: 31%
- Canceling extras like insurance or subscription services: 29%
- Downgrading to a cheaper plan: 20%
- Joining a family or shared plan: 17%
These strategies can add up to real savings, especially for people in the cities paying over $200 per month.
How to Cut Your Phone Bill (Without Losing Your Number)
Looking for practical ways to save on your wireless bill? These tips can help you chip away at phone bill costs, especially in places where wireless costs are already among the highest.
Audit your plan & eliminate extras
Start by trimming what you don’t need. Many people carry add‑ons like device insurance, international roaming, extra data, or premium messaging that they rarely use.
Use Wi‑Fi whenever you can
Rely more on Wi‑Fi at home or work to reduce mobile data usage. It’s one of the easiest ways to push your average bill lower.
Consider switching providers
If your carrier doesn’t respond to your request, shop around. Many newer or niche providers offer comparable service at lower cost, especially if you’re okay with minimal extras.
Join or form a family/shared plan with trusted users
Sharing data or lines can lower cost per person, though it’s important to manage use so individual bills don’t balloon.
Port your number and use forwarding services
If your service is underused (for example, during a travel period or move), you can transfer or port your number to a provider like NumberBarn, park it, and avoid paying a full monthly carrier plan fee. This allows you to keep your number and reactivate later with minimal cost. You can also forward it internationally, if you need to save money on phone costs from a traditional wireless carrier while abroad.
If you’re looking to dial back your phone bill, the good news is you can relieve the squeeze on your monthly finances with some of the tips above and a little creativity and flexibility.
Methodology
Average monthly wireless phone bill data comes from the Council for Community and Economic Research (C2ER)’s Cost of Living Index (Q2 2025), which estimates pricing based on standardized usage patterns across U.S. cities. Actual consumer phone bills may vary based on individual carriers, discounts, data usage, or bundled family plans. The COLI methodology uses weights derived from the U.S. Consumer Expenditure Survey to reflect how households allocate spending across categories (utilities, housing, services, etc.).
Tax rate data comes from the Tax Foundation and the Committee on State Taxation, 50-State Study and Report on Telecommunications Taxation, which includes state and local wireless taxes across all 50 states. Federal wireless tax data is based on the Federal Universal Service Fund surcharge.
In September 2025, we surveyed 1,004 American residents across the country. Survey respondents were asked about their wireless phone expenses, budgets, and usage.
Demographics: The survey respondents included 48% females, 50% males, and 2% identifying as non-binary/non-conforming. The average age of the respondents was 46 years.
Limitations: The survey responses rely on self-reporting, which may be subject to recall bias or social desirability bias.
Sources: Council for Community and Economic Research (C2ER) 2025, U.S. Bureau of Labor Statistics (BLS) Consumer Expenditure Survey, Tax Foundation, Committee on State Taxation, 50-State Study and Report on Telecommunications Taxation
Fair Use
When using this data and research, please attribute by linking to this study and citing https://www.numberbarn.com.
Media Inquiries: For media inquiries, contact media@numberbarn.com